Jumping Jacks Project:
Jumping Jacks
I absolutely love doing jumping jacks, especially on a Wednesday morning. I know you love doing them as well! Do you think you can do more than anyone else in the class? First, let’s talk a little bit about them…….
How many jumping jacks do you think you could do in 10 seconds?
Sarah, Bella, and Thomas said they could do at least 20 jumping jacks. Tony said he could do 4 jumping jacks
How many do you think you could do in 20 seconds?
Our group decided that we could do 20 to 50 jumping jacks in 20 seconds.
What about the number you could do in 120 seconds?
Sarah, Tony, Thomas, and Bella said they could set the bar high with numbers like 50, 70, and 60 jumping jacks in 120 seconds but they would have to make sure they don’t over-do it.
After each response above, justify why you think you can do that many.
Sarah says because
Bella says
Tony says
Thomas says
Jumping Jack Experiment
You will need a group of four people:
• a jumper- sarah(to do jumping jacks)
• a timer- Tony (to keep track of the time)
• a counter-Thomas (to count jumping jacks) • a recorder- Bella (to write down the number of jumping jacks at each time interval)
As a group, decide who will do each task. Do not worry, each person will get a chance to do each job and we will do a practice round.
Here is what happens:
1. The timer will say “GO”.
2. The jumper will start doing jumping jacks as fast as they can. Careful, you will be doing them for 120 seconds. Think about how you can do the most in that amount of time.
3. The counter will count the number of jumping jacks being done.
4. The recorder will write down the number of jumping jacks at each 10 second time interval.
So…….
When the timer says “go,” the jumper begins doing jumping jacks.
The jumper continues jumping for 2 minutes.
The counter counts the jumping jacks out loud.
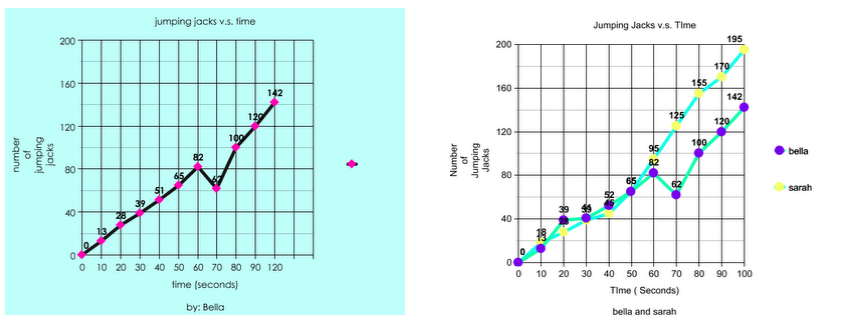
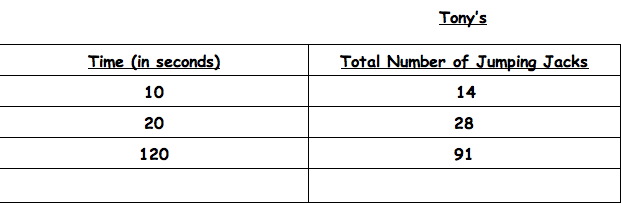
Every 10 seconds, the timer says “time” and the recorder records the total number of jumping jacks the jumper has done.
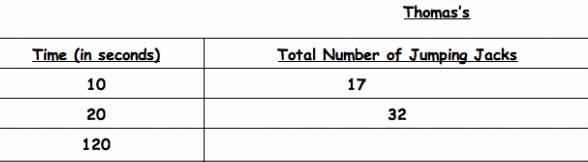
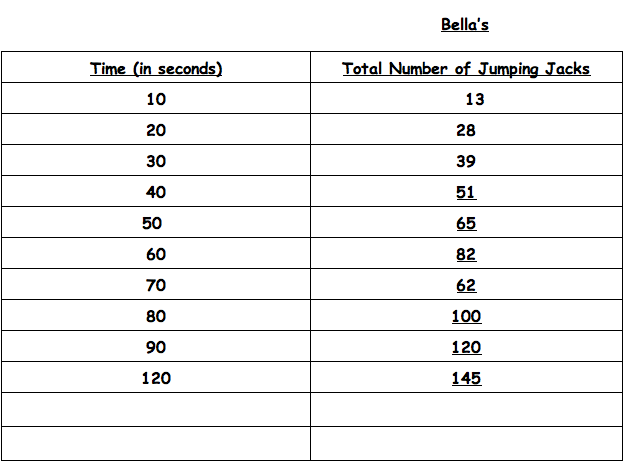
The recorder should use the following table:
I absolutely love doing jumping jacks, especially on a Wednesday morning. I know you love doing them as well! Do you think you can do more than anyone else in the class? First, let’s talk a little bit about them…….
How many jumping jacks do you think you could do in 10 seconds?
Sarah, Bella, and Thomas said they could do at least 20 jumping jacks. Tony said he could do 4 jumping jacks
How many do you think you could do in 20 seconds?
Our group decided that we could do 20 to 50 jumping jacks in 20 seconds.
What about the number you could do in 120 seconds?
Sarah, Tony, Thomas, and Bella said they could set the bar high with numbers like 50, 70, and 60 jumping jacks in 120 seconds but they would have to make sure they don’t over-do it.
After each response above, justify why you think you can do that many.
Sarah says because
Bella says
Tony says
Thomas says
Jumping Jack Experiment
You will need a group of four people:
• a jumper- sarah(to do jumping jacks)
• a timer- Tony (to keep track of the time)
• a counter-Thomas (to count jumping jacks) • a recorder- Bella (to write down the number of jumping jacks at each time interval)
As a group, decide who will do each task. Do not worry, each person will get a chance to do each job and we will do a practice round.
Here is what happens:
1. The timer will say “GO”.
2. The jumper will start doing jumping jacks as fast as they can. Careful, you will be doing them for 120 seconds. Think about how you can do the most in that amount of time.
3. The counter will count the number of jumping jacks being done.
4. The recorder will write down the number of jumping jacks at each 10 second time interval.
So…….
When the timer says “go,” the jumper begins doing jumping jacks.
The jumper continues jumping for 2 minutes.
The counter counts the jumping jacks out loud.
Every 10 seconds, the timer says “time” and the recorder records the total number of jumping jacks the jumper has done.
The recorder should use the following table:
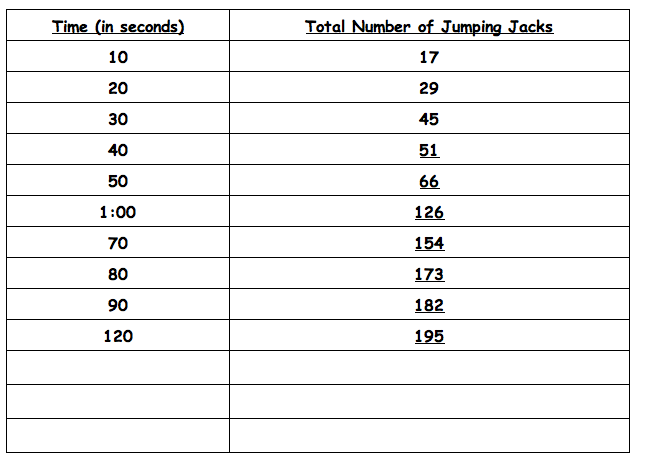
sarah's ^
When everyone has has a chance to do each job, come back to the room and let Mr. Shawn know you are done.
Discuss the following question with your group. Discuss each jumpers data. You only need to record the answers for your data, but discuss it with your group.
How did the jumping jack rates (the number of jumping jacks per second) in your group change as time passed?
How is this shown in your tables?
Graphing Instructions
There are four steps when creating a graph.
1. Identify the two variables.
Variable: a quantity that changes or varies
What are the two variables in your experiment? In other words, what are the two things that changed in your experiment? List them below:
Variable 1:
Variable 2:
2. Select an axis to represent each variable:
When labeling each axis, ask yourself this question………
Which variable depends on the other?
The variable, or thing that changes, that depends on the other goes on the y-axis.
The variable, or thing that changes, that does not depend on anything, goes on the x-axis. List the variables as dependent or independent.
Dependent Variable:
Independent Variable:
3. Select a scale for the x-axis and the y-axis.
You should always try and the entire piece of graph paper. In our case, we will be using a program to create the graph. It will still be important that the graph takes up a majority of the space.
4. Plot the data points.
Again, we will enter our data point into the computer, and the program will create the graph for us.
Now that you have the idea of how to create a graph, go to the site:
http://nces.ed.gov/nceskids/createagraph/
Discuss the following question with your group. Discuss each jumpers data. You only need to record the answers for your data, but discuss it with your group.
How did the jumping jack rates (the number of jumping jacks per second) in your group change as time passed?
How is this shown in your tables?
When everyone has has a chance to do each job, come back to the room and let Mr. Shawn know you are done.
Discuss the following question with your group. Discuss each jumpers data. You only need to record the answers for your data, but discuss it with your group.
How did the jumping jack rates (the number of jumping jacks per second) in your group change as time passed?
How is this shown in your tables?
Graphing Instructions
There are four steps when creating a graph.
1. Identify the two variables.
Variable: a quantity that changes or varies
What are the two variables in your experiment? In other words, what are the two things that changed in your experiment? List them below:
Variable 1:
Variable 2:
2. Select an axis to represent each variable:
When labeling each axis, ask yourself this question………
Which variable depends on the other?
The variable, or thing that changes, that depends on the other goes on the y-axis.
The variable, or thing that changes, that does not depend on anything, goes on the x-axis. List the variables as dependent or independent.
Dependent Variable:
Independent Variable:
3. Select a scale for the x-axis and the y-axis.
You should always try and the entire piece of graph paper. In our case, we will be using a program to create the graph. It will still be important that the graph takes up a majority of the space.
4. Plot the data points.
Again, we will enter our data point into the computer, and the program will create the graph for us.
Now that you have the idea of how to create a graph, go to the site:
http://nces.ed.gov/nceskids/createagraph/
